
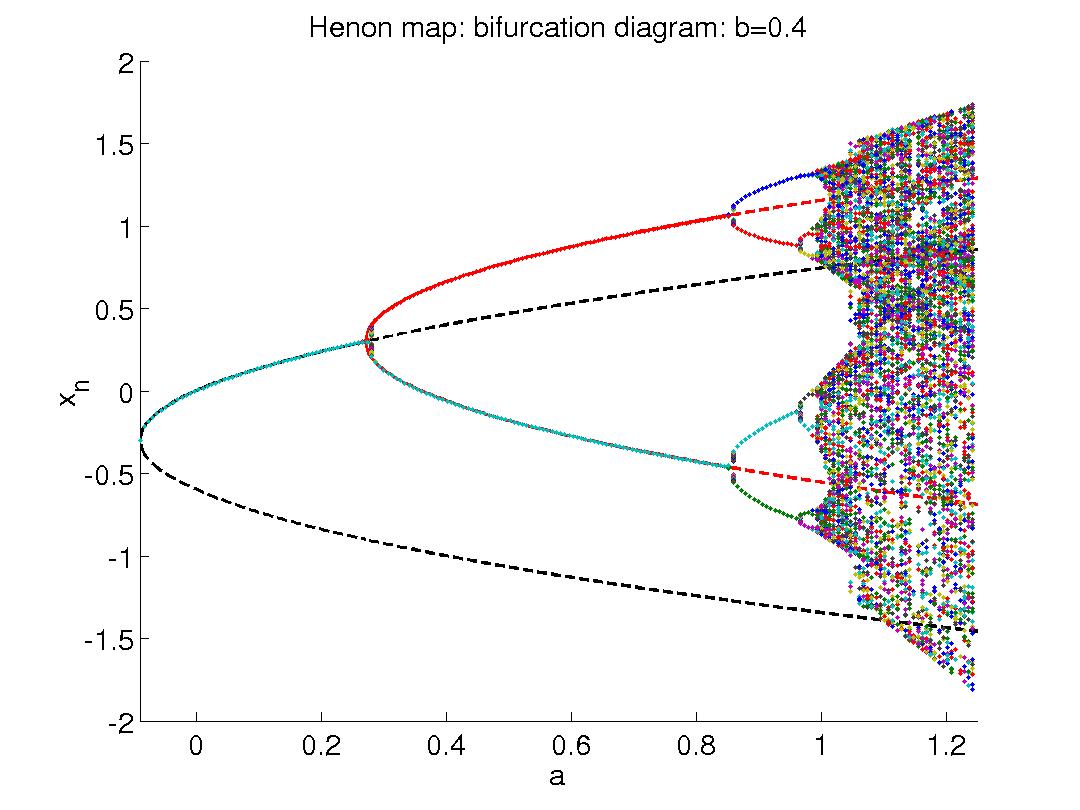
xn+1= 1 – axn2 + bxn,
(a and b are parameters)
Michel Henon, an astronomer at the observatory in Nice, France, was born in Paris in 1931. Curious about the degradation of celestial orbits, he began to model the orbits of stars around the centers of their galaxies.
Henon considered gravitational centers as a three dimensional object (as opposed to a point in space) and carefully studied the orbits of the stars. To simplify the task of trying to track a three dimensional orbit, he considered, instead, the intersection of a plane with these orbits. Initially, the intersection points appeared to be completely random in their location, moving from one edge of the plane to the next. However, after a few dozen points were plotted, a closed, egg-shaped curve began to appear. This mapping was, apparently, the cross section of a torus (i.e., a doughnut).
Henon (along with one of his graduate students) continued to study this mapping and continued plotting the points for a system with increased energy levels. Once the newer mappings were made, though, the continuous curve began fading and random points began to appear proportionally to the energy. Over the years, Henon tried many ways to predict the upcoming points of his high-energy graph until finally, he decided to abandon classical methods and use difference equations.
Applying a formula to force the data into the shape of a crescent moon, Henon found some interesting results. The formula was fairly simple. Take the old y and multiply it by 0.3 (b). Then subtract 1.4 (a) times the old x squared. Finally add one to the whole equation. This yields this system:
xnew= y – 1.4×2 + 1
ynew= 0.3x
Although, at first, it seems like an ordinary curve, closer inspection reveals distinct curves, one thicker than the other. If we magnify the picture, we see that each of these curves is also made up of two similar curves. This happens for every possible magnification of the curve.
In astronomy, Michel Hénon was a leading figure in the field of stellar dynamics, galactic dynamics, and the evolution of the rings of Saturn. In mathematics, he is known for the so-called Hénon maps and attractor, which is one of the most studied chaotic systems.
In the late 1960s and early 70s, he worked on the star clusters and by using Monte Carlo methods, he developed numerical techniques to follow the dynamics of globular clusters. His probabilistic method proved to be much faster than usual N-body methods.
He published a two volume book on restricted three-body problem.
He died on April 2013 in Nice.
http://adsabs.harvard.edu/cgi-bin/nph-a … &version=1
https://arxiv.org/pdf/1411.4930
https://www.youtube.com/playlist?list=P … 6-akNgLG7-_